Projects Sharing

Introduction

BeOptimized was founded in 2015 and specializes in SAS technologies. Since 2020, to meet the growing demand for Python, we launched a Python-oriented service. This versatility allows us to be more competitive in the market and gives us the flexibility to work on SAS projects, Python projects, and even SAS/Python combined projects.

To make this transition possible, we began by learning the Python language through books and websites.
For the books , we started with Python for SAS Users which was an excellent starting point for SAS users transitioning to Python. We also explored other books, such as: Data analysis in Python, Docker et Conteneurs, Kubernetes, Machine learning with Scikit-Learn, Data Analysis with Python an Pyspark, Python & Django... However, the best book I read was Effective Pandas as data manipulation is a key skill for succeeding in data-related fields.
AS for websites, platforms like DataCamp and SoloLearn are great, but the Python Institute stands out as the best. They offer free study resources, including a web-based Python programming environment. Their chapters conclude with summaries and questions, which are perfect for anyone looking to pass their online certification.

The various topics discussed on the project-sharing web pages were created with two objectives in mind: to assist BeOptimized in its day-to-day activities and to strengthen our Python knowledge. They are end-to-end data engineering projects used everyday by BeOptimized, created not just for fun. Indeed, it's one thing to learn a programming language from books or websites, but you truly understand and master it when you practice.

We don't use AI in our projects. When we get stuck, we turn to Google or Stack Overflow. Our main goal is to learn Python, not just to deliver projects.

The projects

In this project, called BeGees, we are monitoring BeOptimized's energy consumption and production in real time.

This project utilizes several open-source packages and covers various aspects of the data lifecycle: data capture, data quality, data transfer, data storage, and data presentation. 
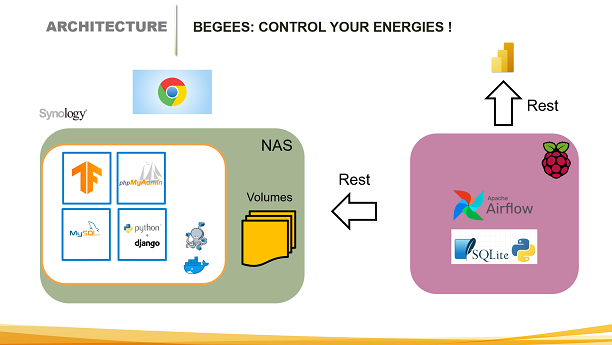
Energy data is captured through a Raspberry Pi connected to a smart meter, and the data is sent to a database via the network. 
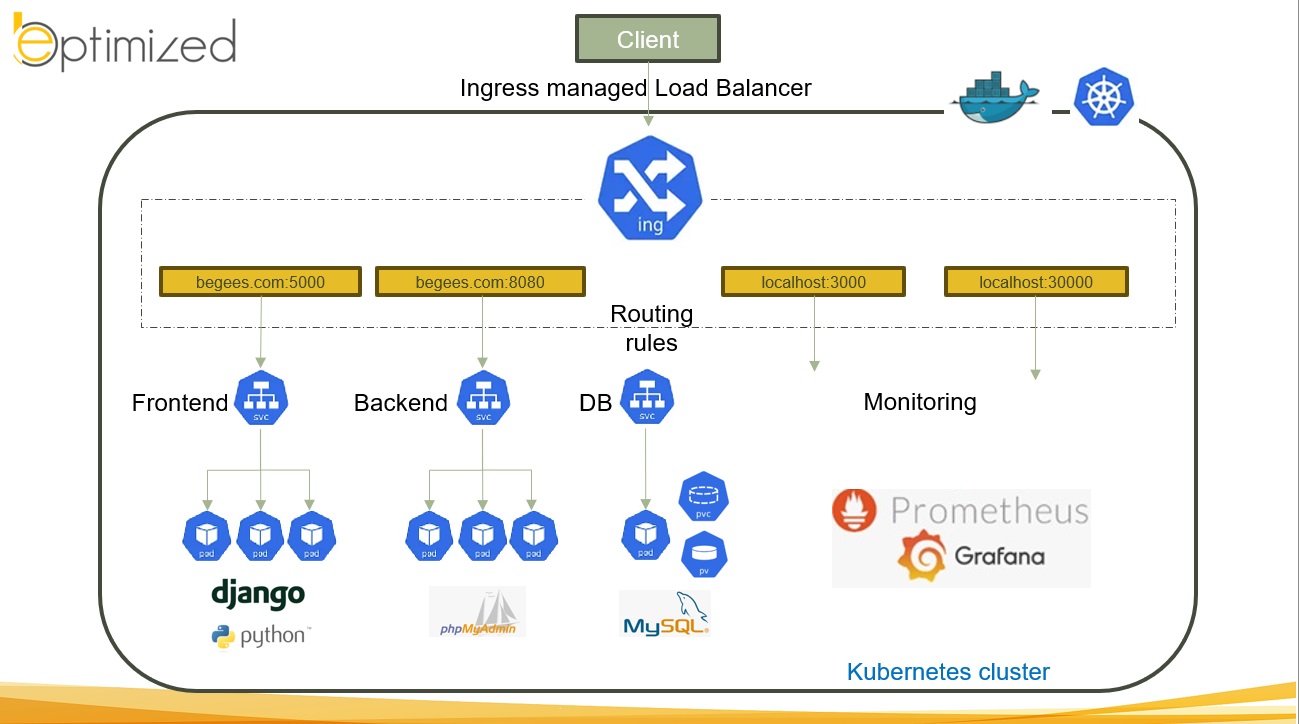
To make this work, all the packages and the database have been converted into containers, orchestrated via Docker Compose. The containers and Docker are run on a NAS server and mounted to my desktop folders.

In this project, we converted the BeGees Docker Compose infrastructure into a Kubernetes cluster.

The entire application was moved from a Synology NAS/Docker Compose environment to Docker Desktop/Kubernetes on Windows 11. The application containers were placed in Pods, and the frontend and backend were set to 3 replicas to increase availability. Prometheus and Grafana are used to monitor the Kubernetes cluster, and an Ingress controller is used for routing rules. The hostname is now begees.com.

In this project, we are monitoring stock evolution and displaying the data on a dashboard using Plotly Dash.

The data source is extracted from the Yahoo Finance API and stored in an SQLite database. The data is transformed using Pandas and displayed on a dashboard with Dash. The stock list, numbers, and values are encoded in an Excel file, which is then read in a Python loop. In addition to the portfolio, a watchlist page was also created to monitor stocks that may enter the portfolio.

In this project, we are analyzing the cash flow evolution of BeOptimized and displaying the data on a dashboard using Plotly Dash.

Most of the data comes from MS Excel, with some data sourced from the BeOptimized website. We import all the data and store it in SQLite. Three pages were created:

  • The Planning & Billed/Unbilled page displays the planning (customers & working days) for the current month, as well as the invoices that still need to be paid for the current month.
  • The Invoice Details page shows a comparison between the current month and previous months.
  • Lastly, the Yearly Evolution page is used to compare the current year with previous years.

The website monitoring project was created to track BeOptimized's website traffic accessible from a central, multi-page dashboard.

To access the data, I used the Google Analytics API with Python. On a daily basis, the data are extracted and stored into a SQLite database and surfaced into the dashboard. The dashboard is simple, showing active users over time, statistics about the users' country, operating system, search engine, and the most visited web pages. For me, this information is sufficient and allows me to save couple of clicks because I don't have to go to the Google Analytics web site anymore.

In this project, we gather job opportunities, store them, and display them on a dashboard using Plotly Dash.

There are plenty of job search engines on the market. I registered with some of them using keywords like SAS+Bruxelles or Python+Bruxelles, and then requested that they send me job opportunities via email on a daily basis. The content of the emails is always structured the same way, so depending on the source, I know how to parse their content and store it in an SQLite database. Finally, all the data is displayed on a large dashboard, allowing me to monitor and analyze all the job listings from a central location.

This site uses cookies. .

By continuing to browse the site you are agreeing to our use of cookies. Review our cookies information for more details.