Jobs monitoring

Introduction

Capturing job offer data is like gold for a freelancer. It provides valuable insights into your market at minimal cost.
In addition to the job offers themselves, there's plenty of information available: Which companies are using SAS or Python today? Is it difficult to find candidates? What is the best time to look for a new mission? What is the market size and where is it located?
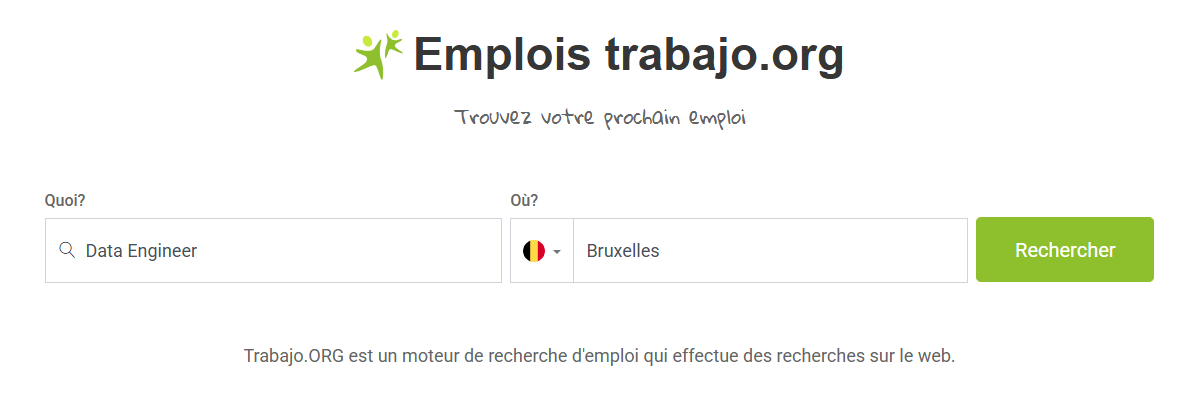
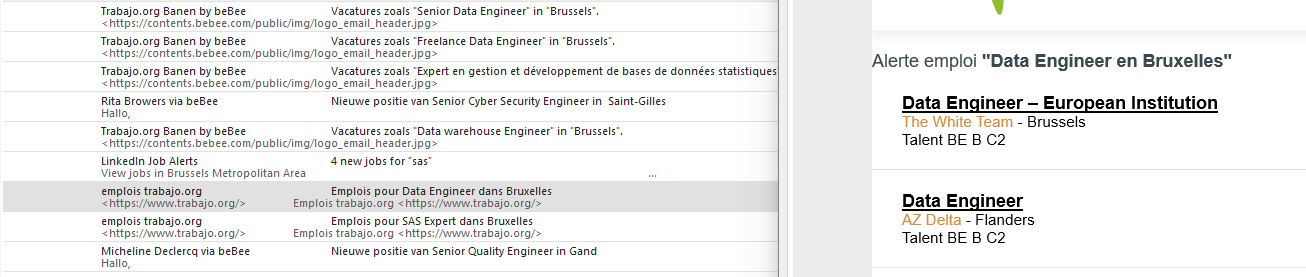
This project wasn't rocket science; we didn't scrape company websites for job opportunities. Instead, we leveraged the power of job search engines to filter the jobs we were looking for.
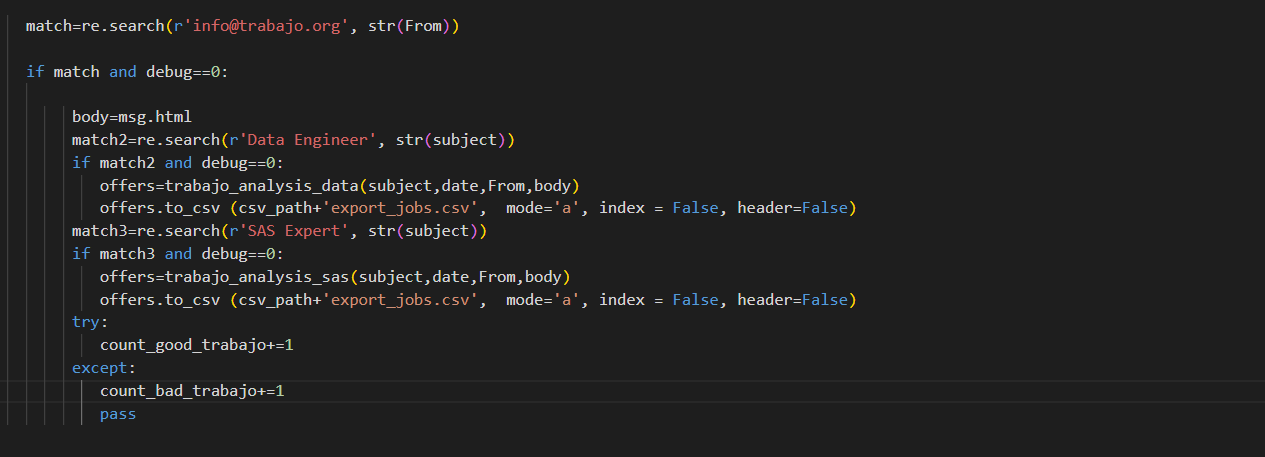
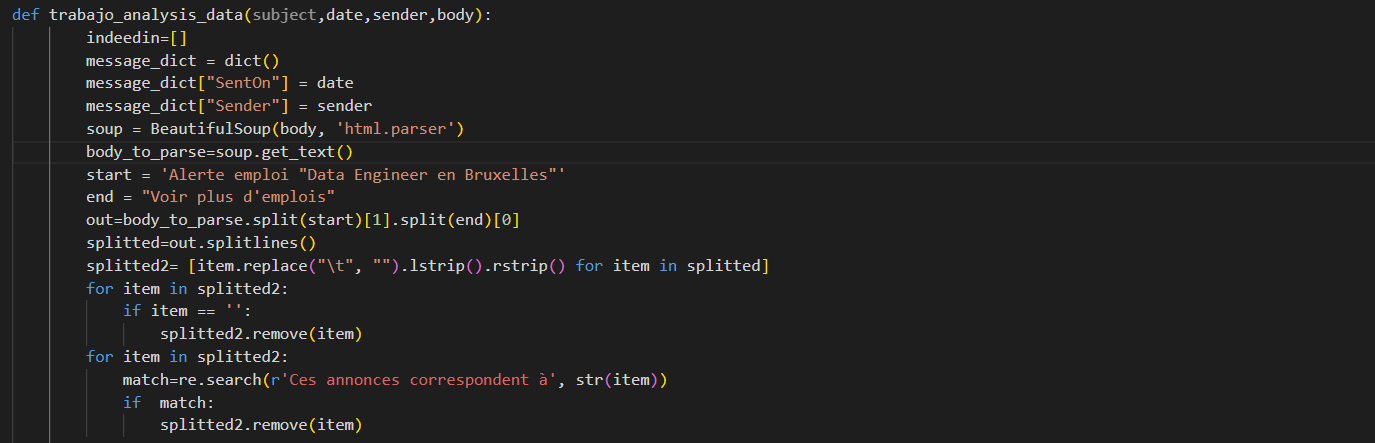
We worked in 5 steps (see the step-by-step screenshots below):

  • We registered with 4 job search engines (Trabajo, ICTjobs, Linkedin, Indeed) using specific keywords and locations, and set up daily newsletters to be sent to a functional mailbox.
  • The functional mailbox is then checked daily, and all the emails are parsed using BeautifulSoup.
  • The parsed emails are cleaned, structured, and saved in an SQLite database.
  • Finally, a dashboard is created to display the data.
Did you know that thanks to this project, we also display jobs opportunities in the BeOptimized web site?

Layout

This dashboard page displays jobs from various job search engines over the past few days. Since there are a large number of job listings, we had to apply several filters to limit the information displayed on the screen.

  • The first line of filter buttons allows you to select the timeframe and location.
  • A vertical stacked bar chart displays the total number of jobs by source over time.
  • To focus more on job types, a horizontal bar chart was added, along with a filter. This was necessary because some job types were too small for the graph, making it less practical to use as a filter.
  • In the center, a grid displays the jobs. Thanks to the markdown option, the grid can include colors, sorting, and hyperlinks.
  • Above the grid, a series of filter buttons can be used to select the job source.
  • Finally, on the left of the grid, a horizontal, dynamic, and clickable bar chart displays the number of jobs per company and can be used to filter jobs by a specific company.
By Christophe Kabacinski Duration 9 mn

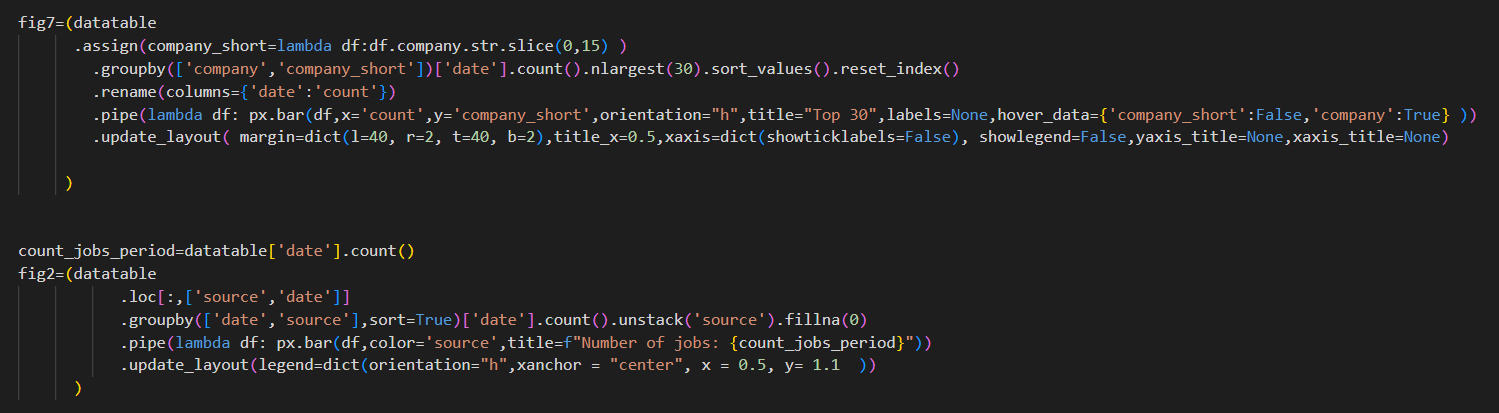
In this video the inputs of the project are briefly described and couple of Python codes are presented.

Dashboard

Grid and cards

Step by step

  • Register job search
  • Get the Emails
  • Decide which parser to use
  • Parse the Emails
  • Create graphics in Dash

This site uses cookies. .

By continuing to browse the site you are agreeing to our use of cookies. Review our cookies information for more details.