The stock monitoring project created to track the evolution of a stock portfolio and watchlist.
The data is obtained through theYahooFinance API.
The idea behind this project was to centralize all the information about my stocks into a single dashboard, without having to jump into various broker applications. While these applications are useful, they cannot be customized to the extent I wanted.
The dashboard was built using Plotly Dash and Python:
Plotly DASH is easy to use, you design a layout with 'components' which allows you to describe the app's look and feel.
Then you define in a callback, how you want to create interactions between the elements (e.g., how a radio button interacts with a graph).
The magic of Dash is that the components are accessible in Python, and behind the scenes, they generate HTML tags and JavaScript code.
The rest of the code is pure Python and, in my case, I used the Pandas
library to handle data transformation, including DataFrame filtering, calculations, concatenations, column selections, and loop iterations.
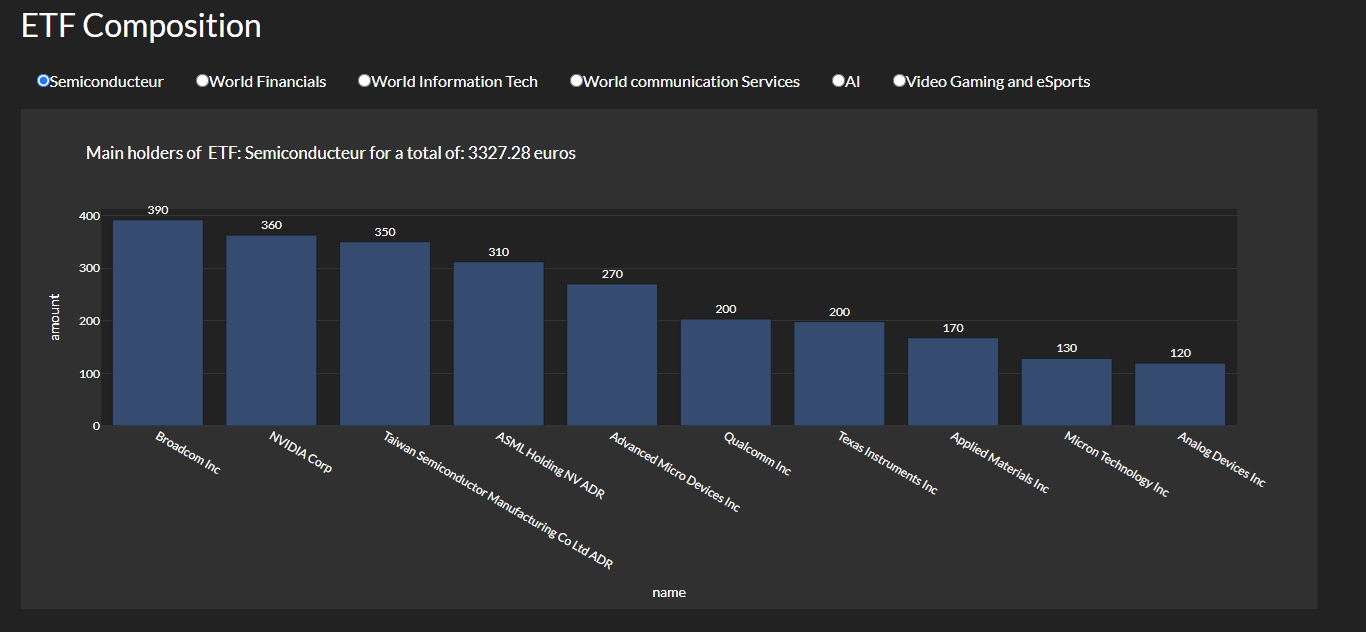
Regarding the other python packages, yfinance was used to obtain stock values and information and yahooquery to get ETF composition.
Finnhub and NLTK have been also used to respectively extract last 3 days of Stocks news and compute a sentiment analysis based on the stocks news.
For sentiment analysis, stock news is screened, words are tokenized, and classified as positive or negative. A global sentiment score is then generated, normalized to range from -1 (most extreme negative) to +1 (most extreme positive).
In order to put that code in 'production', I encapsulated it into a Docker container hosted on my local NAS server.
This container has a mounted folder on the NAS to store input files permanently. Thanks to the Windows network drive, I can access the files from my desktop.
The NAS is turned off every night and wakes up at 7 a.m. During the wake-up process, the container is rebuilt, and the Dash app automatically refreshes the underlying data.
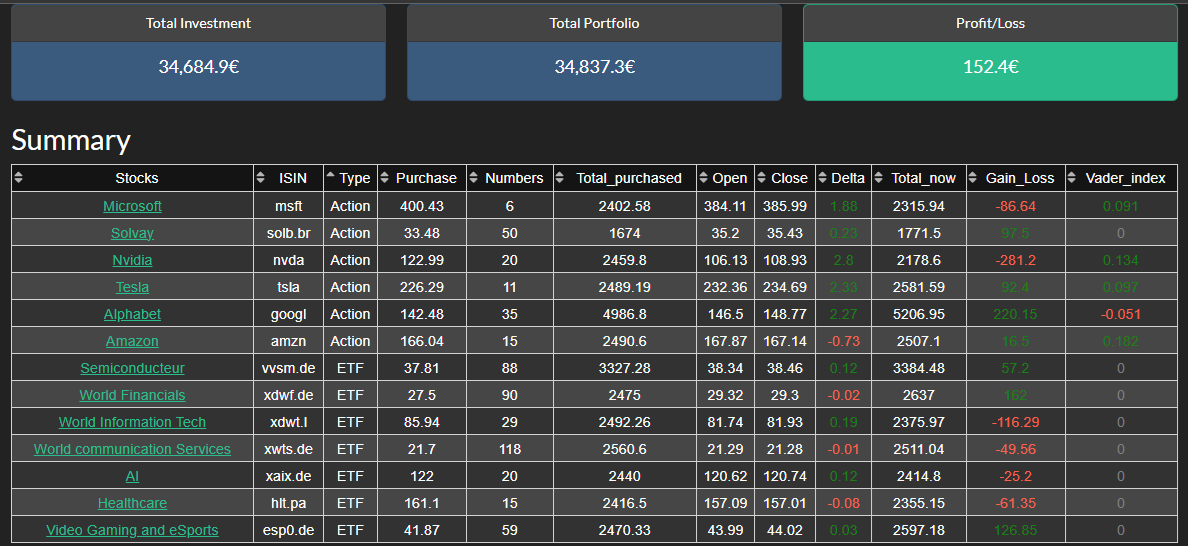
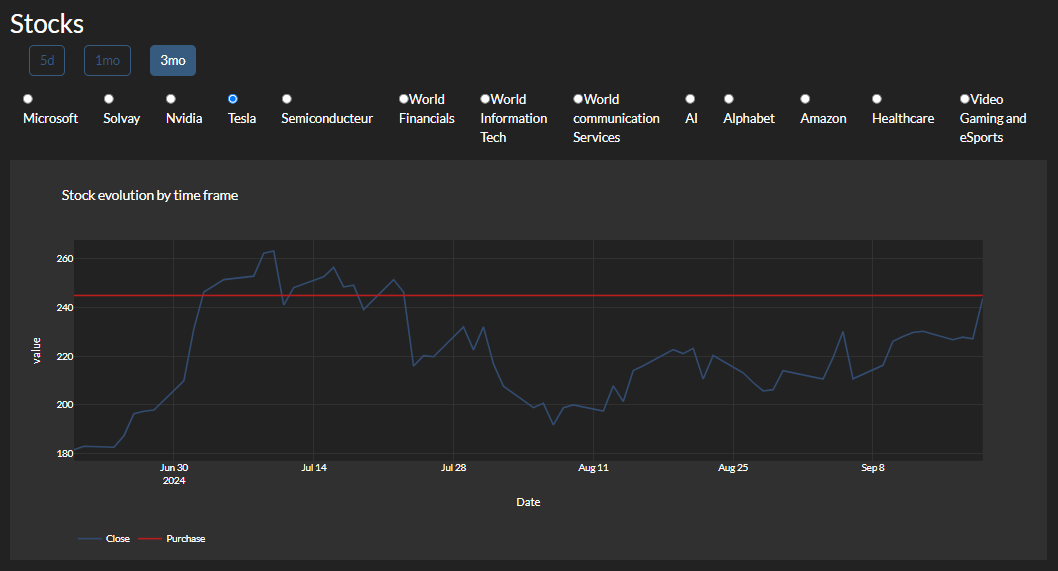
The stock portfolio dashboard was the first page created in the project. Later, a second page was added for watchlist monitoring , which tracks selected stocks that are not yet in the portfolio (useful for performance and sentiment analysis).
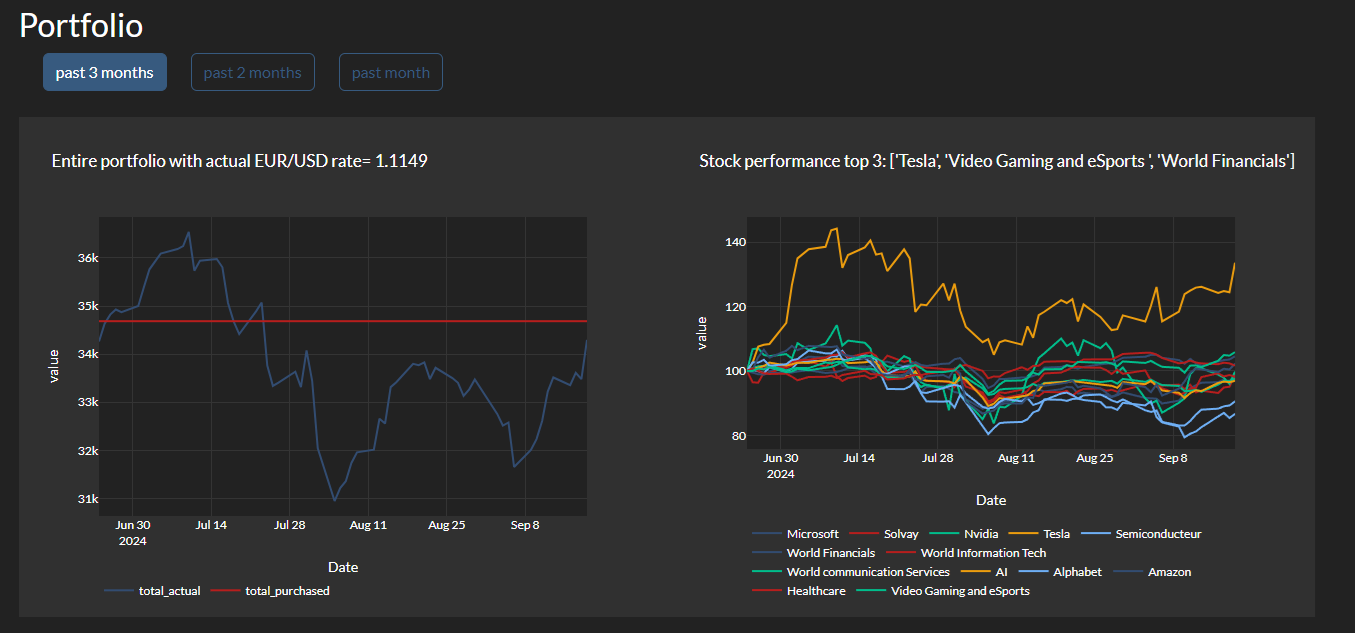
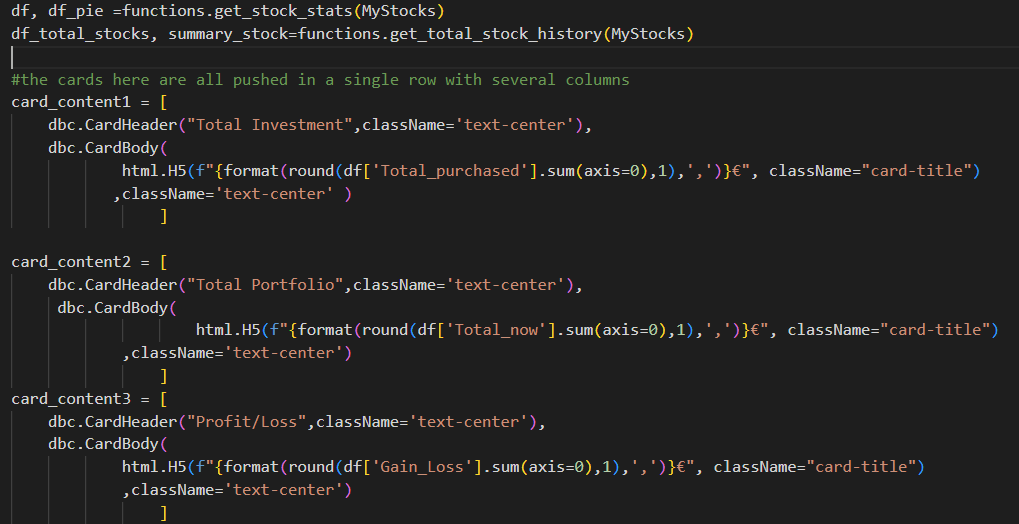
This dashboard page displays all the stocks informations of the portfolio:
In this video the inputs of the project are briefly described and couple of Python codes are presented.

By continuing to browse the site you are agreeing to our use of cookies. Review our cookies information for more details.