Web site monitoring

Introduction

You can track website traffic with different tools, but each time, you have to open the application and log in. If you want to monitor multiple things, you have to repeat this process every time, which can waste a lot of time if done regularly.
The website monitoring project was created to track the BeOptimized website traffic from a central, multi-page dashboard. This way, the DASH app is always open, up-to-date, and displays only the information I need. 
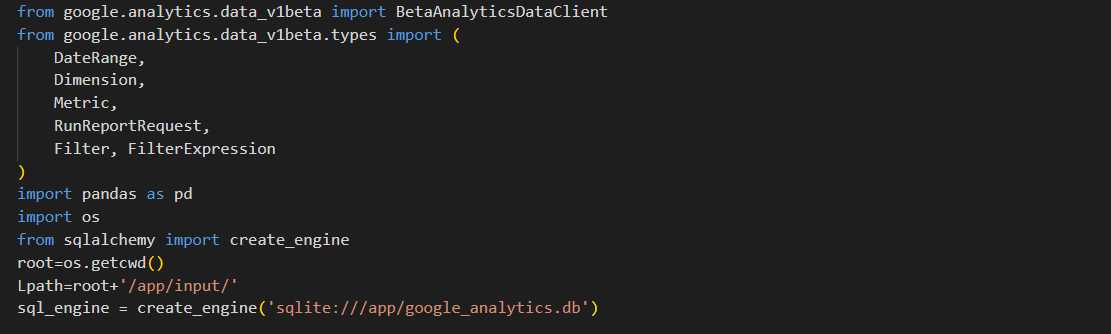
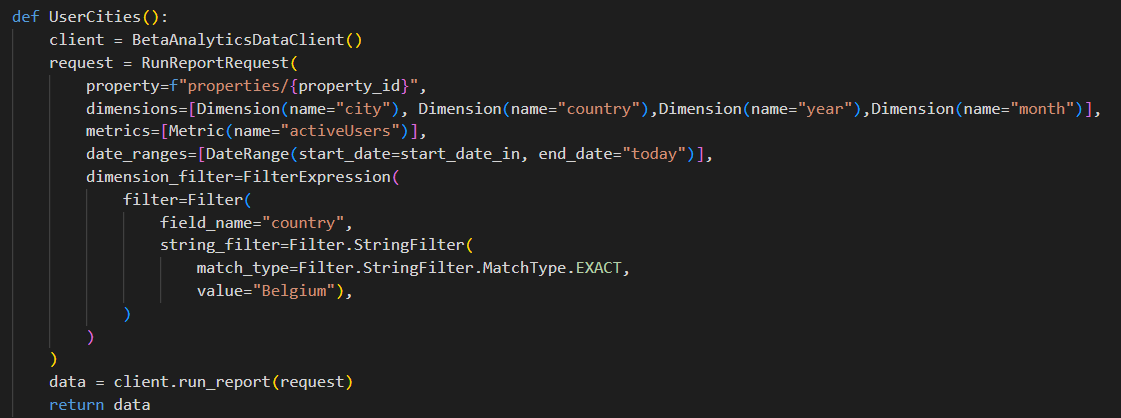
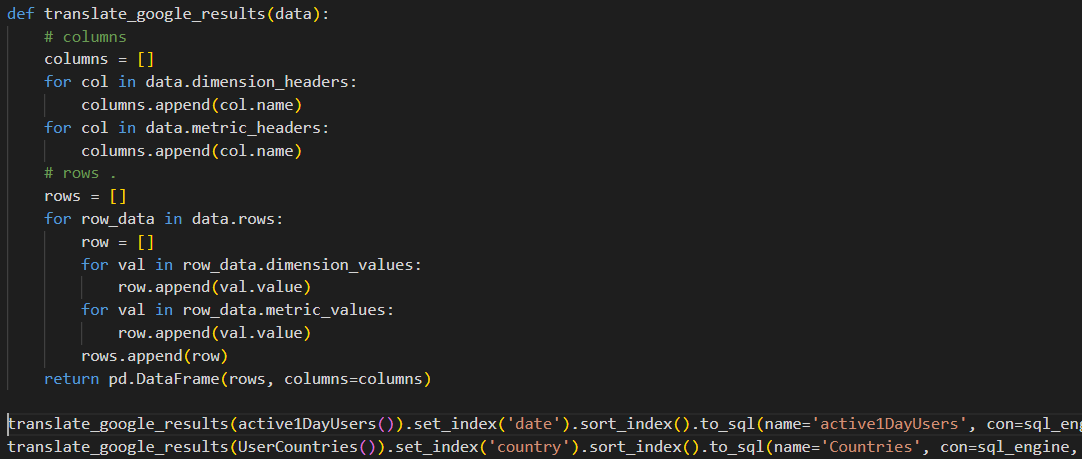
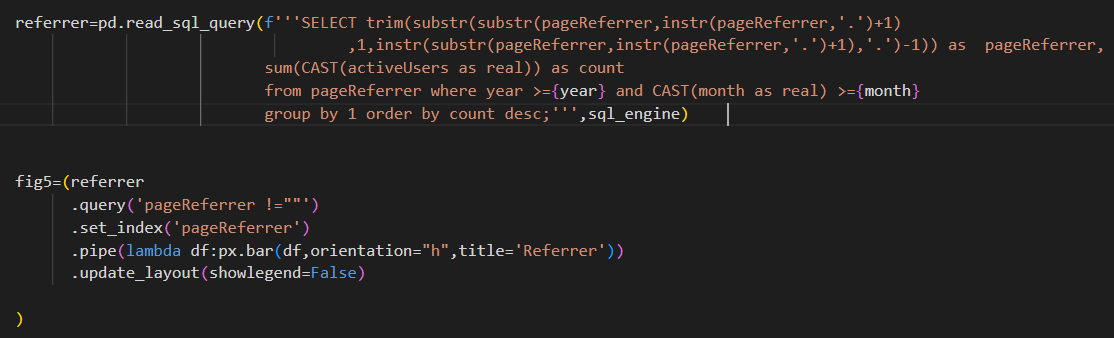
The dashboard is simple, showing active users over time, stats about the issuer's country, operating system, search engine, and the most visited web pages. For me, this information is enough. To access the data, I used the Google Analytics API using Python.

Basically, it was created using the following steps:

  • Firstly, you need to register with Google Analytics and add a JavaScript function to your website so that Google can monitor the statistics (I am still using analytics.js in my case). You can find more info on this topic here. This function collects statistics into a database accessible from the Google Analytics website.
  • Secondly, to access the data in Python, the google.analytics.data package was installed. This package allows you to run parameterized report requests and returns the statistics in JSON format. Parameters include metrics (e.g., number of active users) and dimensions (e.g., country, city, page title). You can also combine dimensions, such as country and year, or month and apply filters.
  • Then, the JSON data is extracted and stored into an SQLite database using SQLAlchemy.
  • Finally, the data is displayed on the dashboard using DASH.

Web site analysis

This dashboard page displays basic statistics about the BeOptimized website:

    • Filter button allows you to select the timeframe: from past 5 days to past year
    • A Line chart displays the total number of users accross time
    • In order to have a better view on the members and operating systems used pie charts were added.
    • Then, 2 bar charts are used to display the country and the referrer
    • Finally, a tile chart display the most views pages
    By Christophe Kabacinski Duration 7 mn

    In this video the inputs of the project are briefly described and couple of Python codes are presented.

Dashboard

Grid and cards

Couple of codes

  • Import Google Analytics
  • Import data from google analytics module with parameters
  • Convert JSON and export to SQLite
  • Query SQLite table and create bar chart

This site uses cookies. .

By continuing to browse the site you are agreeing to our use of cookies. Review our cookies information for more details.